
Verplichte BBV-indicatoren
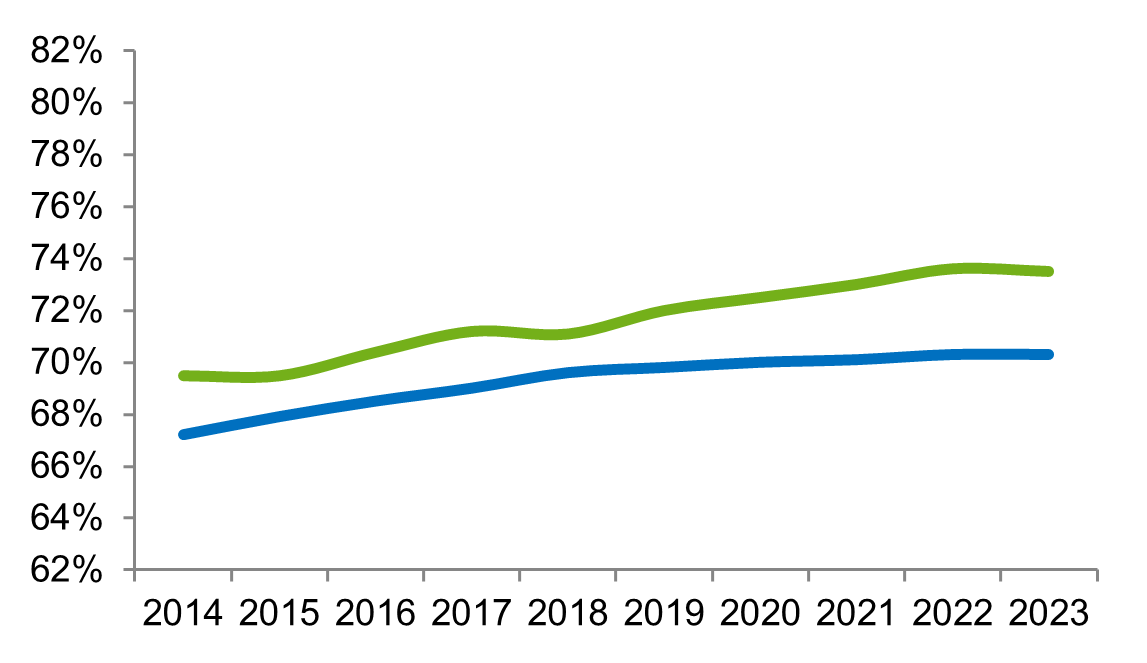
Demografische druk
Het aantal personen van 0 tot 20 jaar en 65 jaar of ouder per honderd personen van 20 tot 65 jaar.
Bron: CBS: Bevolkingsstatistiek
Legenda grafiek
Groen: Westland
Blauw: Nederland
|
Jaar |
Westland |
Nederland |
|
2014 |
69,5% |
67,2% |
|
2015 |
69,5% |
67,9% |
|
2016 |
70,4% |
68,5% |
|
2017 |
71,2% |
69,0% |
|
2018 |
71,1% |
69,6% |
|
2019 |
72,0% |
69,8% |
|
2020 |
72,5% |
70,0% |
|
2021 |
73,0% |
70,1% |
|
2022 |
73,6% |
70,3% |
|
2023 |
73,5% |
70,3% |