
Verplichte BBV-indicatoren
Nieuw gebouwde woningen
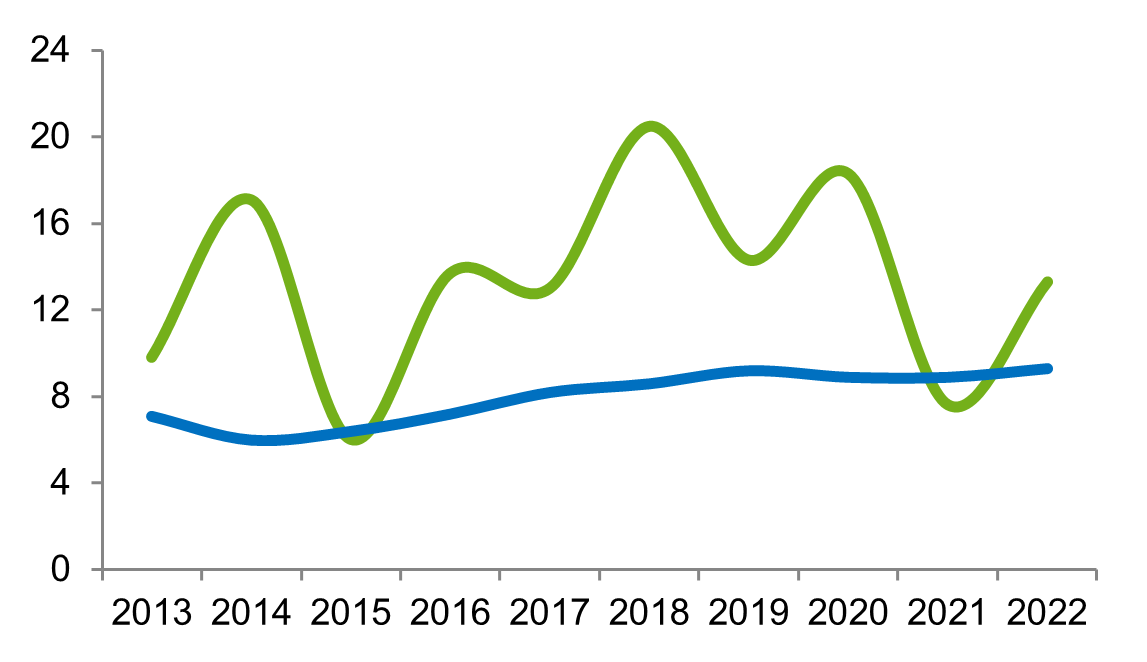
Het aantal nieuw gebouwde woningen per 1.000 woningen, exclusief overige toevoegingen zoals transformaties.
Bron: BAG/ABF
Legenda grafiek
Groen: Westland
Blauw: Nederland
|
Jaar |
Westland |
Nederland |
|
2013 |
9,8 |
7,1 |
|
2014 |
17,1 |
6 |
|
2015 |
6 |
6,4 |
|
2016 |
13,7 |
7,2 |
|
2017 |
13 |
8,2 |
|
2018 |
20,5 |
8,6 |
|
2019 |
14,3 |
9,2 |
|
2020 |
18,3 |
8,9 |
|
2021 |
7,6 |
8,9 |
|
2022 |
13,3 |
9,3 |